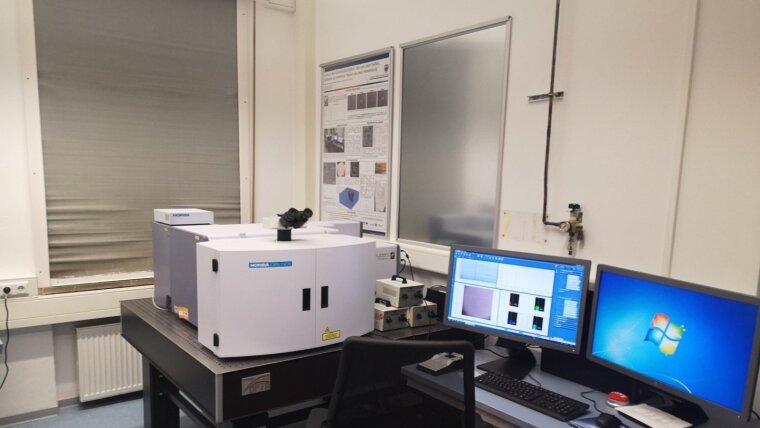
Ein modernes Horiba LabRam Spektroskop
Information
For information on introductions and applications please contact Deon Janse van Rensburg.
To reserve please use this calendarExternal link. Reservations are only possible for those who have been given an introduction
The Raman effect was predicted theoretically in 1923, but not demonstrated until 1928 by the Indian physicist C.V. Raman, for which he was awarded the Nobel Prize in Physics in 1930. In Raman spectroscopy, monochromatic laser light is backscattered from a sample and part of this scattered light spectrum is analyzed for wavelength change and intensity.
Since June 2016, the Chair of General and Historical Geology at the IGW has been operating a Raman laboratory centered around a Horiba VIS-NIR LabRAM HR Evolution.
The instrument is equipped with four power adjustable lasers (458, 532, 633 and 785 nm), five Olympus objectives (5x, 10x, 20X, 50X 100X, calibration objective), a spectroscope with 800 mm focal length and a high sensitivity frontilluminated EM-CCD (400-11nm) in a Peltier cooled detector. The motorized xyz stage allows precise sample positioning and 3-D confocal measurements with a spatial resolution of about 1 µm in x, y and z; the SWIFT mapping module allows rapid mapping of large areas. The spectral resolution depends on the wavelength of the laser used and the grating resolution, selectable between 600 and 1800 lines/mm, and is about 0.5 to 0.2 cm-1.
The workstation, distributed over two large screens, is equipped with the interactive, graphically oriented LabSpec6 software, which is linked to the KnowItAll spectral database for phase identification and multivariate spectra analysis; an integrated module provides multiple 3D representations of volumes and surfaces. The software and hardware allow rapid calibration, motorized control of many hardware components, and, if desired, largely automated operation.
The instrument is located on a stable, passive optical table in the basement of the institute and is classified as laser class 1 due to its complete enclosure.
The backscattered Raman signal (<1% of the irradiated energy) is filtered and its spectrum is spread in a spectroscope of high focal length (800 mm). The microscope with objectives up to 100x allows high spatial resolution. Thus, samples down to 1 µm in size can be repeatedly approached and illuminated. If the mineral is at least semi-transparent, three-dimensional data cubes can also be generated. Uneven surfaces are detected and compensated.
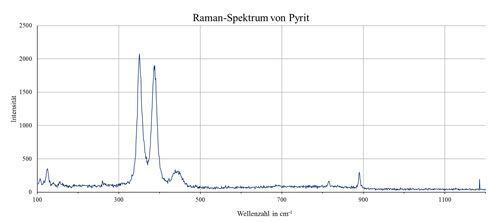
Raman spectrum of pyrite
Image: IGW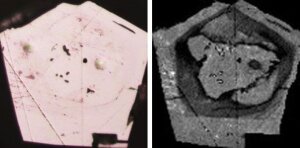
Raman spectra of Kerogen
Image: IGW- Raman can be used to map surfaces and record mineral properties such as zoning. In the microscopic image (left), the zoning of the pyrite grain is barely recognisable, but easily visible in the Raman image (which maps the intensity of a characteristic spectral peak).
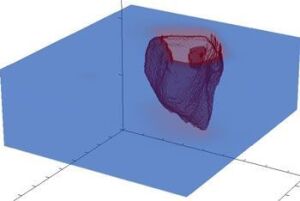
Baryte inclusion in quartz
Image: IGW- Three-dimensional mapping of (at least semi-transparent) minerals allows to detect the microstructure of smallest inclusions.

Inclusions in quartz
Image: IGW- Raman spectra measured on an inclusion show a combination of surrounding quartz (peaks on the left) and the fluids CO2-rich water and H2S trapped in the inclusion (peaks on the right).
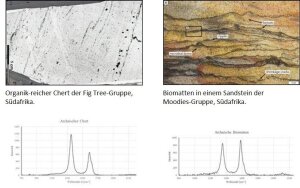
Raman spectra of Kerogen
Image: IGW- Raman spectra of kerogen (remains of organic material) show the thermal maturity of rocks. The kerogen spectrum of the example on the bottom right shows a higher structural order (max. T of approx. 430°C) due to the right peak (the graphite peak) than the spectrum of the sample on the left (max. T approx. 380°C).
Logo Thüringer Landesministerium für Wirtschaft, Wissenschaft und Digitale Gesellschaft and the European Fund for Regional Development (EFRE)
Image: IGWWe would like to thank the Thuringian Ministry for Economy, Science and Digital Society and the European Regional Development Fund (ERDF) for funding the MinGeoRaman project to establish a Raman microspectroscopic workstation at the Institute of Geosciences at Friedrich Schiller University Jena.